Time-variant latent growth model
1. What the Growth Model Represents
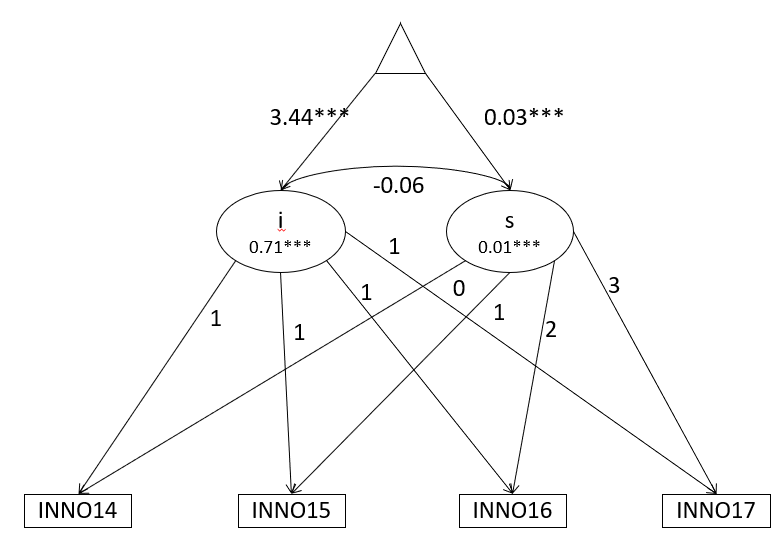
The model tracks national innovation levels across four years:
- INNO14
- INNO15
- INNO16
- INNO17
The growth trajectory is captured by two latent factors:
| Latent factor | Meaning |
|---|---|
| i (intercept) | Initial innovation level |
| s (slope) | Rate of innovation change |
The loadings define a linear growth model:
| Year | Intercept loading | Slope loading |
|---|---|---|
| 2014 | 1 | 0 |
| 2015 | 1 | 1 |
| 2016 | 1 | 2 |
| 2017 | 1 | 3 |
This means innovation is assumed to change linearly over time.
2. Intercept (Initial Innovation Level)
From M4:
Intercept mean = 3.439*
Interpretation:
The average national innovation level at the starting year (2014) is 3.44.
The value is highly significant (p < 0.001).
Intercept variance
0.709*
Interpretation:
Countries differ significantly in their initial innovation levels.
Some start much more innovative than others.
3. Innovation Growth Rate
Slope mean:
0.027*
Interpretation:
On average, national innovation increases by 0.027 units per year.
So the trajectory is:
| Year | Expected innovation |
|---|---|
| 2014 | 3.439 |
| 2015 | 3.466 |
| 2016 | 3.493 |
| 2017 | 3.520 |
This indicates steady but modest innovation growth.
Slope variance
0.006*
Interpretation:
Countries differ in how fast innovation grows.
Some countries experience faster innovation improvement than others.
4. Relationship Between Initial Innovation and Growth
Covariance:
−0.004 (diagram shows standardized −0.06)
Interpretation:
Countries with higher initial innovation tend to experience slightly slower growth, although the effect is small.
This suggests a mild convergence pattern:
- Low-innovation countries may catch up slightly.